6 min read
Summerlin Market Activity: Week of Oct 26 to Nov 1, 2026
The Summerlin community entry sign in Las Vegas, Nevada. Updated Nov 2, 2026. By Rich Rogers, REALTOR®, NV S.0205007, Keller Williams Realty The...
6 min read
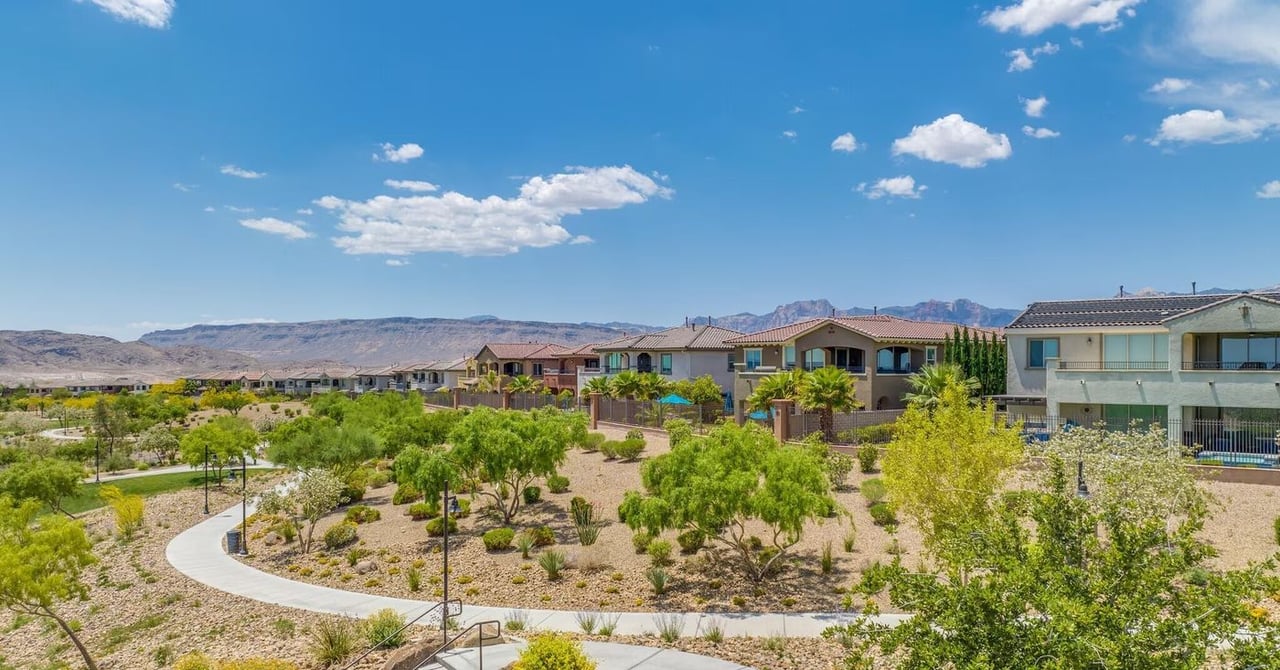 Walking trails in Summerlin West, Las Vegas, Nevada.
Updated Nov 2, 2026. By Rich Rogers, REALTOR®, NV S.0205007, Keller Williams Realty The Marketplace, Summerlin, Las Vegas.
Follow me on X at @realRichRogers for updates between issues.
Snapshot: Summerlin West in Las Vegas added 11 new listings and closed 9 sales this week, and 10 homes went under contract. 208 homes are for sale, down 16 from last week, and 37 are under contract. 9 listings were withdrawn and 9 expired. 16 sellers cut their price and 5 more homes relisted lower. This week's median sale was $985,000, or $367 per square foot, against 90-day figures of $780,750 and $350. The top sale was $1,410,000. Homes sold in the last 90 days spent a median 33.5 days on the market.
(This report counts every resale single-family home in ZIP 89138 as Summerlin West. Builder and new-construction homes are left out.)
Rich's Take: You may have read that U.S. home-sale prices just fell year over year for the first time in more than three years, and that pending sales hit a record low. Here in Summerlin West, however, closings held steady: 9 sales this week and 9 the same week in 2025 (RPR, both years). The median sale jumped to $985,000 from $788,800, but price per square foot fell 5.8%, to $367 from $389. Bigger homes sold, at a little less per foot.
Active listings fell by 16 to 208, and 10 homes went under contract against 11 new listings. Nearly one in, one out. That's a better balance than Summerlin overall this week, and supply eased slightly to about 5.6 months from 5.7. Not a turnaround. More like taking the foot off the brake for a second.
Remember: If you trade (sell and buy) in the same market, the discount you give on the sale you can get back on the purchase. Don’t let market conditions impacting a sale keep you from upgrading your home and improving your lifestyle.
Summerlin West has a variety of villages. Remember to price against recent sales in your own village, not the Summerlin average. I can help you with all of this.
|
What changed this week Summerlin West Week of Oct 26 to Nov 1, 2026 |
|||||||||
|
|||||||||
|
|||||||||
|
Source: GLVAR Matrix MLS (LVR MLS), Oct 26 to Nov 1, 2026. Resale single-family homes only. Builder and new-construction homes are left out. Withdrawn includes conditional withdrawals. |
Five homes came back on the market lower, including one now at $1,100,000 that was $1,200,000 when it was withdrawn. Sellers who adjust are getting attention. Sellers who wait are adding days on market, reducing their leverage during negotiations.
Top changes:
Same calendar dates, Oct 26 to Nov 1, 2025. Closings come from RPR for both years. The MLS cannot rebuild last year's actives, price cuts, supply or days on market, so those rows say so.
| Metric | This week | Same dates last year | Change | Trend |
|---|---|---|---|---|
| New listings | 11 | 17 | -6 (-35.3%) | Down |
| Median asking price, new listings | $1,069,000 | $999,900 | +$69,100 (+6.9%) | Up |
| Median asking price per sq ft, new listings | $448.61 | $428.32 | +$20.29 (+4.7%) | Up |
| Closed sales (RPR) | 9 | 9 | 0 (0.0%) | Flat |
| Median sold price (RPR) | $985,000 | $788,800 | +$196,200 (+24.9%) | Up |
| Median sold price per sq ft (RPR) | $366.52 | $388.97 | -$22.45 (-5.8%) | Down |
| Active listings | 208 | Not available in MLS | Not comparable | Not comparable |
| Price cuts | 16 | Not available in MLS | Not comparable | Not comparable |
| Months of supply | About 5.6 | Not available in MLS | Not comparable | Not comparable |
| Median days on market, active listings | 56 | Not available in MLS | Not comparable | Not comparable |
Small sample: 9 closings in each year. One sale can move the price rows a long way, so treat the sold price and price per square foot changes as a snapshot, not a trend.
Fewer sellers listed this week than last year, 11 against 17, and they asked a bit more. Buyers paid a bit less per foot. That's the gap to watch going into the holidays.
Last 7 days vs. last 90 days
| Last 7 days (Oct 26 to Nov 1) | Last 90 days (Aug 3 to Nov 1) | Change | |
|---|---|---|---|
| Median sold price | $985,000 | $780,750 | up 26.2% |
| Median sold $/sq ft | $367 | $350 | up 4.8% |
| Sales | 9 | 112 |
This week's 9 sales came in above the 90-day median, in total and per square foot. Last week it was the opposite. With only 9 sales, that's mostly the mix of homes, not a change in value. Closed sales ran from $500,000 to $1,410,000. Sold homes over 90 days took a median of 33.5 days to sell.
The Days On Market calculation:
The 208 active listings show a median of 56 days on market (average 67.7) and a median CDOM of 69 days (average 97.1), Nov 2, 2026 (LVR MLS). CDOM carries over when a home is relisted. These are days so far for homes still for sale, not days to sell. Last week the median was 52 days.
Homes that sold over 90 days took a median of 33.5 days. Homes still for sale have already waited 56. If yours is past the 60-day mark, the market has been giving you feedback. It's worth listening.
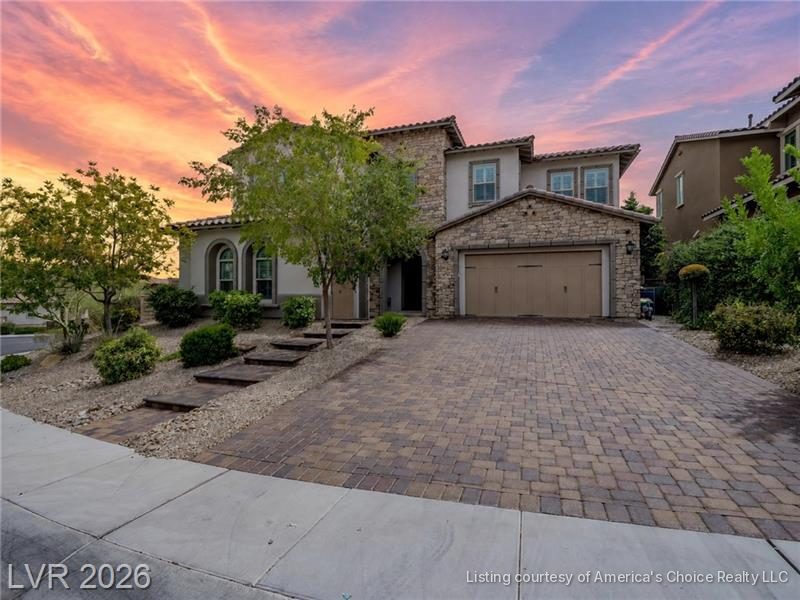
12013 Tramonto Avenue. It sits near Vassiliadis Elementary, perched up high above its neighbors. The price was cut this week to $1,895,000. It is still active as of Nov 2, 2026. The seller is still offering a 3-2-1 rate buydown. I've held this home open many times, so I know it well, including a few things the photos don't show. Email me at rich@r3luxury.com and I'll set up a private showing.
Sources:
GLVAR Matrix MLS (LVR MLS), pulled 4:11 to 4:43 AM PST Nov 2, 2026. Residential, single-family, ZIP 89138. Builder and new-construction homes are left out: a home is excluded when the MLS Builder field is filled and it was built in 2025 or later, or when its Built Description is New, To Be Built or Under Construction. Resale homes with a blank Built Description are kept. "Active" means Active status; "under contract" means Under Contract Show, Under Contract No Show or Contingent On Sale. Weekly changes use Matrix status-change and price-change timestamps, Oct 26 to Nov 1, 2026. Withdrawn includes 4 conditional withdrawals. Previous prices for price cuts are worked out from the MLS change percent and rounded. Price per square foot is close price divided by living area. Prior-week figures are from the Oct 26, 2026 files.
Year-over-year comparison: same calendar dates, prior year, GLVAR MLS via Matrix. New listings are Matrix searches by list date, Oct 26 to Nov 1 of each year, all statuses. Closed sales for both years are from RPR (narrpr.com), close dates Oct 26 to Nov 1 of each year.
Mortgage rates: Mortgage News Daily Rate Index, Nov 2, 2026. Valley supply and median from Las Vegas REALTORS, September 2026. Figures can change as agents update the MLS.
Rich Rogers, REALTOR®, NV S.0205007, Keller Williams Realty The Marketplace, Summerlin, Las Vegas. rich@r3luxury.com
6 min read
The Summerlin community entry sign in Las Vegas, Nevada. Updated Nov 2, 2026. By Rich Rogers, REALTOR®, NV S.0205007, Keller Williams Realty The...
6 min read
Updated Nov 2, 2026. By Rich Rogers, REALTOR®, NV S.0205007, Keller Williams Realty The Marketplace, Summerlin, Las Vegas. Follow me on X at...
6 min read
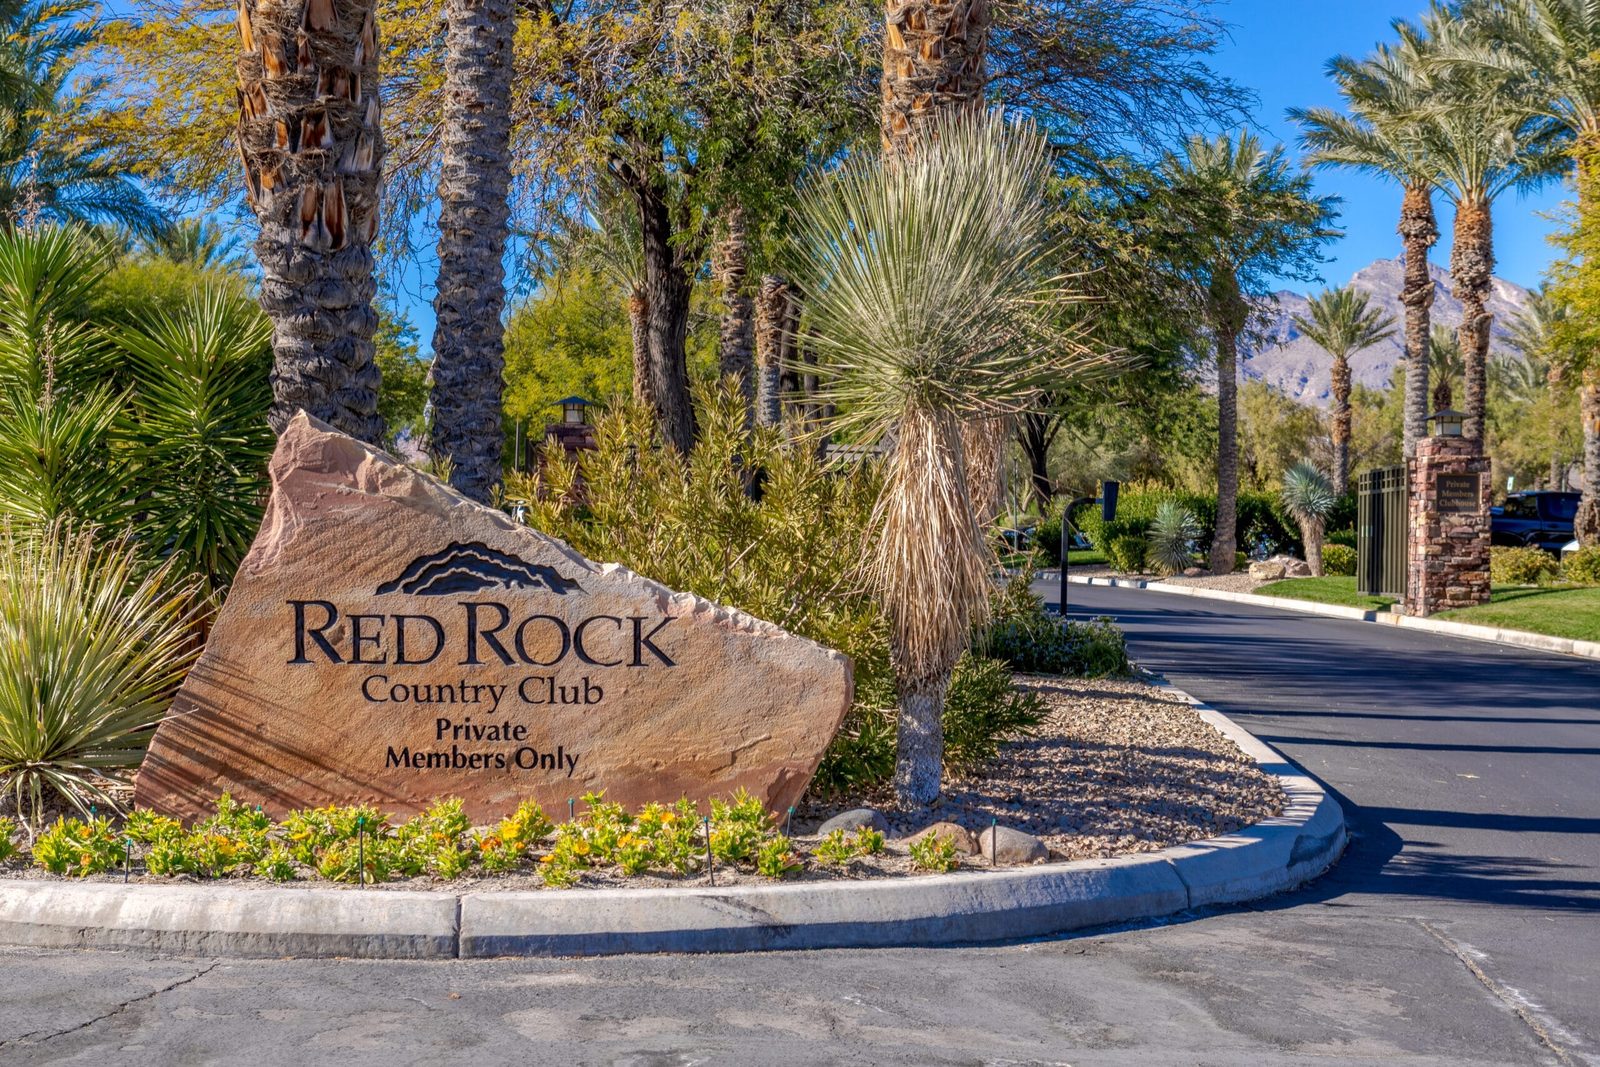
Red Rock Country Club in Summerlin, Las Vegas, Nevada. Updated Nov 2, 2026. By Rich Rogers, REALTOR®, NV S.0205007, Keller Williams Realty The...